
Global Markets Report

Economic News | Equities | Rates | Gold | Brent Cross-Asset Context Prepared: 5 September 2026 | Market data to 4 September 2026 where applicable
Asset class | Current area | Technical bias | Key support | Key resistance |
U.S. equities | S&P 500 ~7,718 | Constructive but rate-sensitive | 7,690 / 7,565 / 7,500 | 7,800 / 7,827 |
Europe equities | DAX ~26,046 | Constructive weekly, short-term cooling | 26,050 / 25,635 / 24,940 | 26,570 / 26,740 / 27,000 |
Asia equities | MSCI EM Asia ~975; Nikkei ~65,021 | Mixed but improving | MSCI 970/959; Nikkei 64,800/63,500 | MSCI 986/1,024; Nikkei 65,500/69,200 |
U.S. rates | 10Y ~4.78%; 5Y 4.52%; 2Y ~4.37-4.38% | Yield pressure remains high | 10Y 4.71 / 4.62 | 10Y 4.80 / 4.84 |
Europe / UK rates | Germany 10Y ~3.34%; UK 10Y ~5.13% | Elevated, overbought in Europe; UK pullback after spike | DE 3.25; UK 5.06 / 4.98 | DE 3.34/3.38; UK 5.18/5.22 |
Gold | ~$4,477/oz | Weekly constructive, daily under pressure | $4,475 / $4,355 / $4,317 | $4,521 / $4,624 / $4,725 |
Brent | ~$96/bbl | Detailed oil note prepared separately | $95 / $90 | $97-$100 / $102-$105 |
Executive Summary
The week ended 5 September 2026 was dominated by rising global bond yields, stronger U.S. labour data, renewed oil-related inflation concerns and selective equity resilience. The overall cross-asset message is that equities are still holding up, but the pressure point has moved back to interest rates. Gold has not benefited consistently from geopolitical risk because higher yields and a firmer dollar have reduced the appeal of non-yielding assets. Brent is being covered in a separate dedicated oil note, but its influence remains central because energy prices are feeding inflation and rate expectations.
The strongest technical trend in this report is still the rise in bond yields. The U.S. 10-year yield is testing the upper end of its daily and weekly ranges, German 10-year yields are pressing the top of the weekly Bollinger Band, and UK 10-year gilt yields remain elevated despite a short-term pullback. Equity charts are constructive but less clean: the S&P 500 remains close to record territory, DAX is supported but showing short-term hesitation, MSCI EM Asia has improved, and Nikkei is trying to stabilise after a sharp pullback from its highs.
Global Economic News
The key U.S. macro event was the August employment report. The Bureau of Labor Statistics reported that total nonfarm payroll employment increased by 162,000 in August and that the unemployment rate was unchanged at 4.1%. Reuters reported that the payroll gain exceeded the 56,000 consensus forecast and increased market expectations of a Federal Reserve rate hike at the 15-16 September meeting.
Bond markets remained the major source of pressure. Reuters described a broad global bond selloff, with the U.S. 10-year Treasury yield near 4.80% and pressure also visible in Japan, Germany and the UK. The same theme is visible in the charts supplied for the U.S. 10-year, German 10-year and UK 10-year yields: yields are elevated, momentum remains positive, and equity upside is increasingly dependent on whether yields stabilise.
In Europe, Reuters reported that euro area inflation accelerated to 3.3% in August, above the European Central Bank target, with economists in a Reuters poll expecting the ECB to raise the deposit rate by 25 basis points to 2.50% at the September meeting. This is relevant for both the DAX and German bund yields: equities are supported by earnings and liquidity, but higher bond yields and energy-linked inflation continue to cap upside.
In Asia, China’s data remained mixed. Reuters reported that the private RatingDog China manufacturing PMI rose to 51.5 in August from 50.9 in July, signalling expansion. AP reported that the official manufacturing PMI rose to 49.8 from 49.2 but remained below the 50 expansion threshold. For Asian equities, this creates a mixed backdrop: the external/export side looks better, but domestic demand remains weaker.
Japan remains a separate macro focus. Reuters reported that the yen strengthened as markets increased expectations of a Bank of Japan rate hike. This is important for Nikkei because a stronger yen and higher domestic yields can pressure exporters and valuation multiples, even if domestic corporate momentum remains supportive.
Current Cross-Asset Drivers
Driver | Main assets affected | Market implication |
Stronger U.S. jobs data | Rates, equities, gold | Raises Fed hike probability; supportive for yields, negative for duration-sensitive assets. |
Global bond selloff | Equities, gold, rates | Higher discount rates cap equity multiples and pressure non-yielding gold. |
Brent and Middle East risk | Rates, gold, equities | Energy inflation keeps central banks cautious; Brent covered in separate oil note. |
ECB rate expectations | DAX, Bunds, euro assets | Supports higher European yields and limits equity upside. |
BOJ tightening expectations | Nikkei, Asia FX, global bonds | Stronger yen and higher JGB yields can affect capital flows. |
China PMI split | MSCI EM Asia, regional cyclicals | Private PMI expansion offsets weak official PMI, but domestic demand remains a concern. |
AI / technology positioning | U.S. equities, Asia exporters | Keeps equity leadership alive but increases vulnerability to disappointment. |
U.S. Equities - S&P 500

Source: Investing.com weekly S&P 500 chart, published 5 Sep 2026 at 09:28:00 GMT.
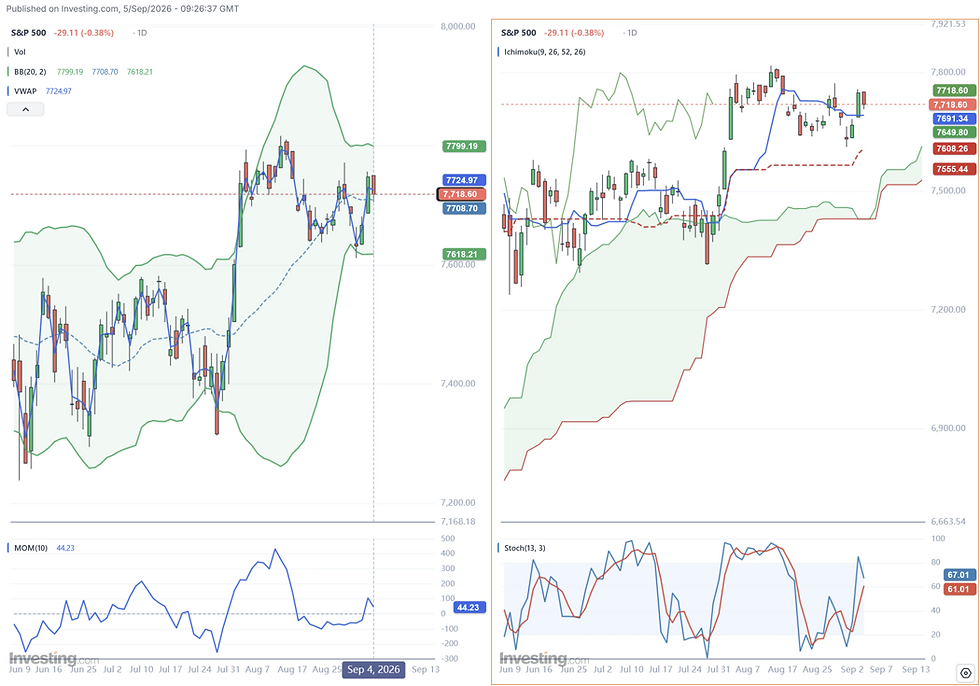
Source: Investing.com daily S&P 500 chart, published 5 Sep 2026 at 09:26:37 GMT.
Technical View
The S&P 500 remains technically constructive on the weekly chart. Price is around 7,718, above the weekly VWAP near 7,696 and above the middle Bollinger Band near 7,500. This confirms that the broader trend has not broken. However, the index is trading close to the upper part of the weekly range, and the daily chart shows consolidation rather than a fresh acceleration.
The daily chart shows price near the short-term VWAP area around 7,725 and below the upper Bollinger Band near 7,799. Momentum is positive but not aggressive, while the stochastic reading has recovered toward the upper part of the range. This suggests the S&P 500 is holding up, but it is sensitive to further increases in bond yields.
Key Levels
Level | Area | Interpretation |
Immediate resistance | 7,780-7,800 | Upper daily range and recent highs. |
Weekly resistance | 7,827+ | Upper weekly Bollinger zone. |
Immediate support | 7,690-7,725 | Daily VWAP and current pivot area. |
Secondary support | 7,565-7,500 | Ichimoku / weekly middle-band zone. |
Deeper support | 7,170-7,320 | Lower weekly support region if risk-off pressure deepens. |
Fundamental Context
U.S. equities fell on Friday after the strong jobs report pushed yields higher and revived expectations of a September Fed hike. Reuters reported that the S&P 500 fell 0.38% on Friday and the Nasdaq fell 0.29%, while semiconductors were among the stronger areas and consumer discretionary was the weakest sector. AP reported that the S&P 500 still finished the week slightly higher, with a 0.1% weekly gain.
Practical View
The S&P 500 remains investable but rate-sensitive. The bullish case requires the index to hold above the 7,690-7,725 pivot and eventually clear 7,800. A break below 7,565 would signal that the rise in yields is beginning to damage equity momentum. The technical structure remains positive, but fresh upside depends on whether U.S. CPI allows yields to stabilise.
European Equities - DAX
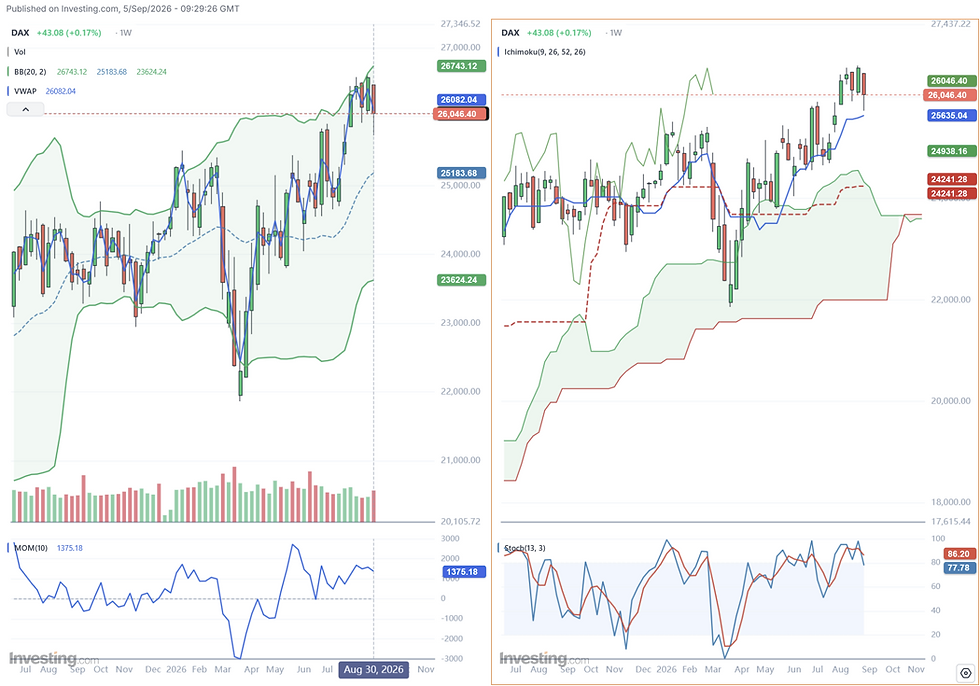
Source: Investing.com weekly DAX chart, published 5 Sep 2026 at 09:29:26 GMT.

Source: Investing.com daily DAX chart, published 5 Sep 2026 at 09:29:51 GMT.
Technical View
The DAX remains constructive on the weekly chart but is showing short-term hesitation. Price is around 26,046, close to the weekly VWAP near 26,082 and below the weekly upper Bollinger Band near 26,743. Weekly momentum remains positive, but the stochastic reading has started to cool from elevated levels.
The daily chart is less clean. Price is near the VWAP area around 26,058 and slightly below the middle Bollinger Band around 26,209. Daily momentum is negative, which suggests that the DAX is trying to rebuild after a short-term pullback rather than leading a fresh breakout.
Key Levels
Level | Area | Interpretation |
Immediate resistance | 26,200-26,570 | Middle Bollinger and upper daily band area. |
Weekly resistance | 26,740-27,000 | Breakout area above recent highs. |
Immediate support | 26,050 | VWAP / current pivot area. |
Secondary support | 25,585-25,635 | Daily Ichimoku / lower support cluster. |
Deeper support | 24,940-25,180 | Weekly support if risk sentiment weakens. |
Fundamental Context
European equities were pressured by rising crude prices, higher yields and persistent inflation concerns. Reuters reported that the STOXX 600 posted a weekly loss of 0.8%, even after a small gain on Friday. The market is now focused on the next ECB meeting, where a 25-basis-point rate increase is widely expected following the rise in euro area inflation.
Practical View
The DAX remains above important weekly supports, but it needs to regain the 26,200-26,570 area to confirm renewed upside. If yields continue rising into the ECB decision, the DAX may remain capped. A weekly close above 26,740 would restore a stronger bullish view, while a break below 25,585 would increase the risk of deeper consolidation.
Asia Equities - MSCI EM Asia and Nikkei 225
MSCI EM Asia
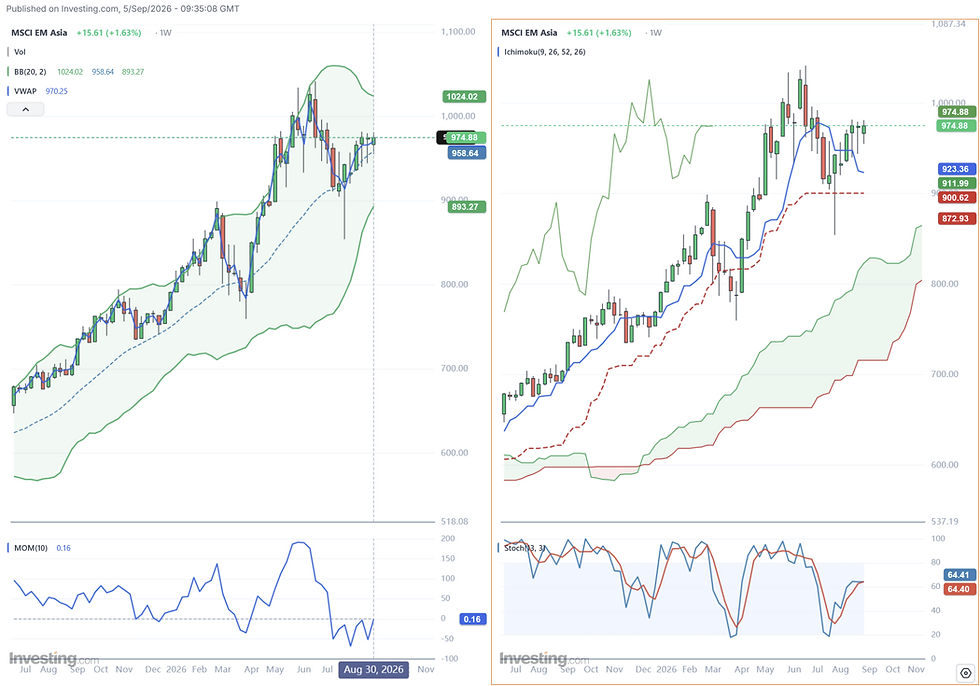
Source: Investing.com weekly MSCI EM Asia chart, published 5 Sep 2026 at 09:35:08 GMT.

Source: Investing.com daily MSCI EM Asia chart, published 5 Sep 2026 at 09:35:15 GMT.
MSCI EM Asia is showing an improving but still capped structure. Price is around 975, slightly above the weekly VWAP near 970 and above the weekly middle Bollinger Band near 959. This is constructive. The next test is resistance near 986 and then the weekly upper band near 1,024. Daily momentum is close to neutral, which means the recovery needs confirmation through a higher close above the 986 area.
Nikkei 225

Source: Investing.com weekly Nikkei 225 chart, published 5 Sep 2026 at 09:33:47 GMT.

Source: Investing.com daily Nikkei 225 chart, published 5 Sep 2026 at 09:33:36 GMT.
The Nikkei is trying to stabilise after a large pullback from its June highs. Price is around 65,021, close to both weekly VWAP near 65,106 and weekly middle Bollinger Band near 65,471. This is a recovery attempt rather than a confirmed bullish continuation. Daily price has moved back above VWAP, but weekly momentum remains negative, so confirmation requires a move through 65,500-66,000 and then the 69,000-69,200 zone.
Fundamental Context
Asia is receiving some support from improved China private-sector manufacturing data and continued AI-linked demand in regional supply chains. Reuters reported that China’s RatingDog manufacturing PMI rose to 51.5 in August, while AP reported that the official PMI rose to 49.8 but remained in contraction. This split supports a selective rather than broad bullish view on Asia. Japan is more complicated because expectations for a Bank of Japan hike and a stronger yen can weigh on exporters even when domestic equities recover.
Practical View
MSCI EM Asia looks technically healthier than it did during the July decline, but it still needs to clear 986 to confirm a higher range. Nikkei needs to hold the 64,800-65,100 pivot and break back above 65,500-66,000. The main risk for Asia is that higher U.S. yields and a stronger dollar tighten financial conditions, while the positive case depends on China stabilisation and AI-linked export demand.
Interest Rates - U.S., Germany and UK
U.S. 10-Year Treasury Yield

Source: Investing.com weekly U.S. 10-year Treasury yield chart, published 5 Sep 2026 at 09:32:06 GMT.

Source: Investing.com daily U.S. 10-year Treasury yield chart, published 5 Sep 2026 at 09:32:16 GMT.
The U.S. 10-year yield is the central chart in the report. It is trading around 4.78%, above daily and weekly VWAP levels and close to the upper Bollinger Band. The weekly stochastic reading is near the top of the range, showing that the yield move is extended, but the trend remains upward until yields fall back below 4.71% and then 4.62%.
U.S. 2-Year and 5-Year Treasury Yield Context
No user-provided 2-year or 5-year Treasury yield charts were included in this batch. For those maturities, the report uses official Federal Reserve H.15 data and Reuters market reporting. The Federal Reserve H.15 release dated 4 September showed nominal Treasury constant maturity yields for 3 September at 4.34% for the 2-year, 4.52% for the 5-year and 4.77% for the 10-year. Reuters reported that, after the August jobs report on 4 September, the 2-year yield rose to about 4.38% and the 10-year yield to about 4.776%.
U.S. Treasury maturity | Latest referenced level | Interpretation |
2-year | ~4.34% official H.15 for 3 Sep; ~4.38% reported after payrolls | Policy-sensitive yield; rising on Fed hike expectations. |
5-year | 4.52% official H.15 for 3 Sep | Intermediate-rate pressure; important for credit and valuation. |
10-year | ~4.77% official H.15 for 3 Sep; ~4.78% chart/reported level | Main discount-rate benchmark; testing resistance. |
Germany 10-Year Yield

Source: Investing.com weekly Germany 10-year yield chart, published 5 Sep 2026 at 09:31:51 GMT.

Source: Investing.com daily Germany 10-year yield chart, published 5 Sep 2026 at 09:31:40 GMT.
Germany’s 10-year yield is around 3.34%, close to the weekly upper Bollinger Band and slightly below weekly VWAP. The broader chart is clearly upward, while daily stochastic readings are easing from elevated levels. Support is around 3.25%, followed by 3.12%. Resistance is near 3.34-3.38%.
UK 10-Year Gilt Yield
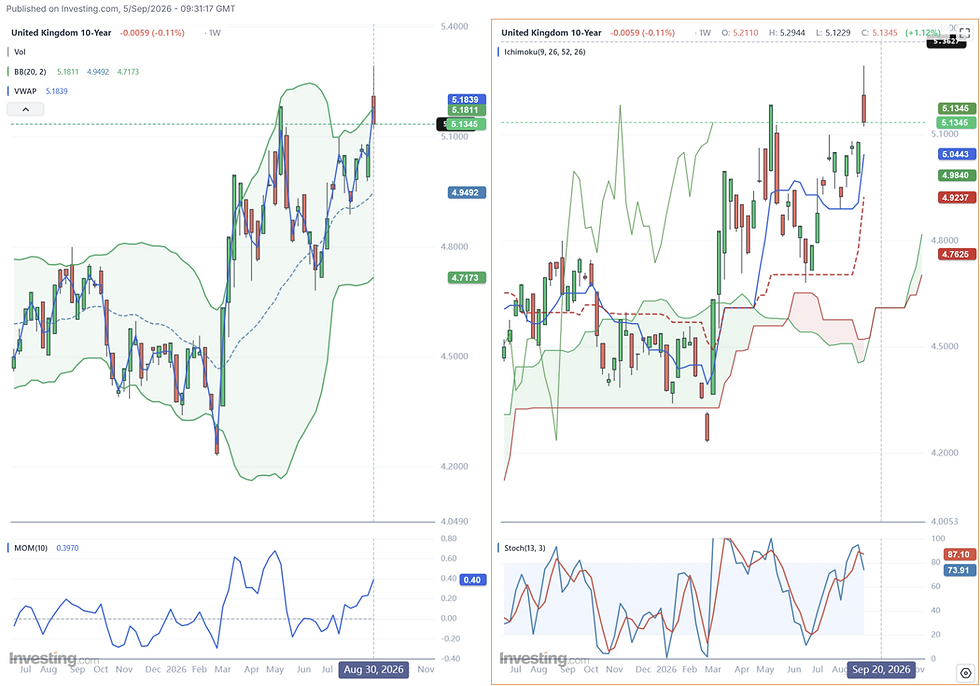
Source: Investing.com weekly UK 10-year gilt yield chart, published 5 Sep 2026 at 09:31:17 GMT.

Source: Investing.com daily UK 10-year gilt yield chart, published 5 Sep 2026 at 09:31:27 GMT.
The UK 10-year gilt yield is around 5.13%. The weekly chart shows a sharp yield spike and a partial pullback, with price just below the weekly VWAP near 5.18. The daily chart confirms the loss of immediate momentum after the spike, but the yield remains elevated. Immediate support is around 5.06, then 4.98. Resistance is around 5.18, 5.22 and 5.30.
Fundamental Context
The rates backdrop is driven by stronger U.S. data, energy-linked inflation risk, higher fiscal concerns and central-bank uncertainty. The Bank of England’s Andrew Bailey highlighted long-term pressures on public debt and borrowing costs in advanced economies. Reuters also reported that UK 10-year yields recently reached their highest level in nearly 20 years, while global bond markets remained under pressure.
Practical View
Rates are the key risk variable. If the U.S. 10-year yield breaks above 4.80-4.84%, pressure on equities and gold is likely to intensify. A move back below 4.71%, followed by 4.62%, would ease cross-asset pressure. In Europe, the German 10-year chart is stretched but still constructive for yields. In the UK, the first question is whether the gilt pullback holds above 5.06 or extends toward 4.98.
Gold Futures
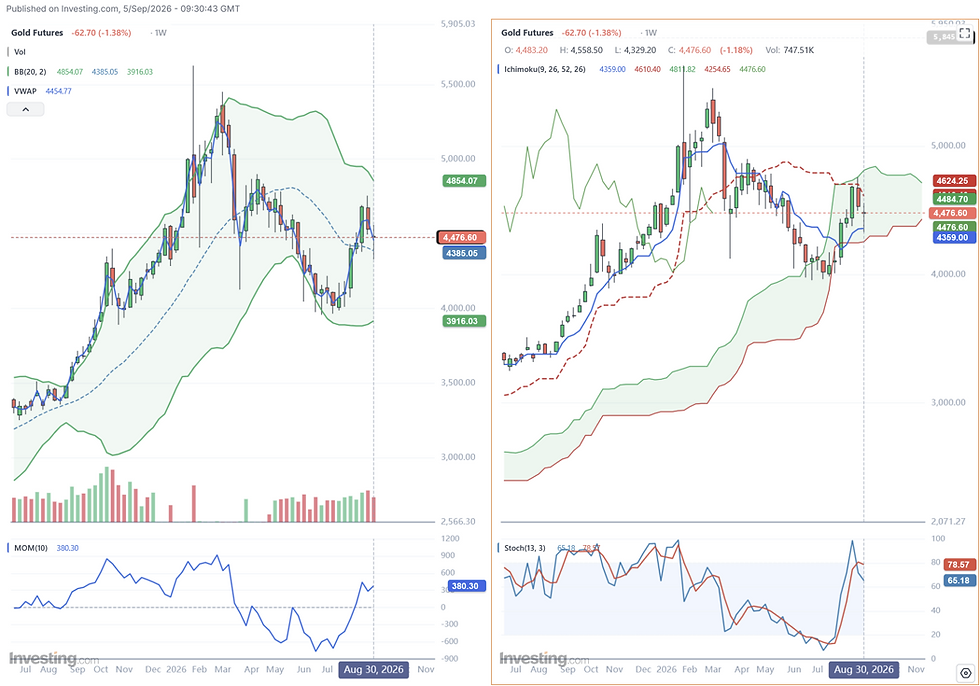
Source: Investing.com weekly Gold futures chart, published 5 Sep 2026 at 09:30:43 GMT.

Source: Investing.com daily Gold futures chart, published 5 Sep 2026 at 09:30:15 GMT.
Technical View
Gold futures are around $4,477/oz. The weekly chart remains broadly constructive because price is above the weekly VWAP near $4,455 and above the weekly middle Bollinger Band near $4,385. However, the daily chart is weaker: price is near VWAP but below the daily middle Bollinger Band near $4,521, and daily momentum is negative.
The chart therefore shows a market that is trying to hold its broader recovery but is vulnerable in the short term. The key immediate support is around $4,475. Below that, the next levels are around $4,355 and $4,317. On the upside, gold needs to recover $4,520 first, then $4,625, followed by $4,725. The weekly upper band near $4,854 is the larger upside zone if yields turn lower or geopolitical risk becomes more directly safe-haven supportive.
Fundamental Context
Gold was pressured by rising Treasury yields and a stronger dollar. Reuters reported that gold fell more than 2% on 1 September to a two-week low as elevated U.S. yields and dollar strength weighed on prices. Reuters later reported that spot gold fell on 4 September after the strong U.S. jobs report increased expectations of a Fed rate hike, while December U.S. gold futures fell 1.4% to $4,476.60.
The important point is that geopolitical risk has not automatically translated into a stronger gold price. In the current environment, geopolitical tension has raised energy prices and inflation concerns, which has lifted yields. Higher yields increase the opportunity cost of holding gold. That explains why gold can fall even when geopolitical risk is elevated.
Practical View
Gold is neutral-to-weak in the short term but not broken on the weekly chart. A daily close below $4,475 and then $4,355 would weaken the recovery. A move back above $4,520-$4,625 would repair the daily structure. The next major catalyst is U.S. CPI: weaker inflation data would likely support gold by reducing yield pressure, while stronger inflation data could keep gold capped.
Brent Crude - Separate Oil Note Reference
Brent is covered in a separate note. For the weekly global report, the important cross-asset message is that Brent near the mid-$90s is keeping inflation risk alive. That matters for bond yields, central-bank expectations and equity valuation. The dedicated Brent note should remain the primary source for detailed oil technical levels and geopolitical interpretation.
Overall Interpretation
The overall market is not in broad risk-off mode, but the tone is less forgiving. U.S. equities remain near highs, DAX is still supported, MSCI EM Asia is improving, and Nikkei is attempting to recover. The problem is that bond yields are rising at the same time. That means equity gains are increasingly dependent on earnings and sector-specific strength rather than broad multiple expansion.
Gold is the clearest example of the current cross-asset tension. In normal conditions, geopolitical stress can support gold. In this week’s market, geopolitical stress is also feeding oil-led inflation risk, which is lifting yields and the dollar. That reduces gold’s safe-haven benefit. This is why gold is technically mixed even as geopolitical risk remains high.
The main conclusion is that the market is being driven by rates. Equities can continue to hold up, but sustained upside requires yields to stabilise. Gold needs either lower yields or a stronger safe-haven impulse. Asia needs dollar and yield pressure to ease. Europe needs confirmation that the ECB tightening cycle will not extend materially beyond September.
Watchlist for Next Week
· U.S. CPI and PPI data, because inflation will determine whether the strong jobs report translates into a Fed hike.
· Federal Reserve communication ahead of the 15-16 September meeting.
· ECB decision and guidance, especially whether the September hike is framed as the final move or part of a longer tightening path.
· U.S. 10-year yield at 4.80-4.84%; a breakout would pressure equities and gold.
· Gold support around $4,475 and resistance at $4,520-$4,625.
· S&P 500 support around 7,690-7,725 and resistance around 7,800.
· DAX support around 26,050 and resistance around 26,570-26,740.
· MSCI EM Asia resistance around 986 and Nikkei resistance around 65,500-66,000.
· Middle East and Brent crude headlines, covered in the separate oil note.
Disclaimer
This report is market commentary based on user-provided technical charts and current public news sources. It is not investment advice, trading advice, or a recommendation to buy or sell any financial instrument. Market levels are approximate and based on the charts and public information available at the time of preparation.
Sources
· User-provided Investing.com charts for S&P 500, DAX, MSCI EM Asia, Nikkei 225, U.S. 10-year Treasury yield, Germany 10-year yield, UK 10-year gilt yield and Gold futures, all published 5 September 2026.
· Bureau of Labor Statistics, Employment Situation - August 2026, published 4 September 2026. https://www.bls.gov/news.release/archives/empsit_09042026.htm
· Federal Reserve Board, H.15 Selected Interest Rates, release date 4 September 2026. https://www.federalreserve.gov/releases/h15/
· Reuters, US nonfarm payrolls blow past expectations in August; unemployment rate steady at 4.1%, published 4 September 2026. https://www.reuters.com/business/us-nonfarm-payrolls-surge-august-unemployment-rate-steady-41-2026-09-04/
· Reuters, Wall Street ends lower as solid jobs data fuels hawkish Fed bets, published 4 September 2026. https://www.reuters.com/business/nasdaq-sp-500-futures-climb-ahead-key-jobs-report-2026-09-04/
· Associated Press, How major US stock indexes fared Friday 9/4/2026, published 4 September 2026. https://apnews.com/article/ebc11cfa2cf8baf4491bf3d4199c1d74
· Reuters, Bond blowback, Trump's oil grab and Broadcom blues: The financial week in five charts, published 4 September 2026. https://www.reuters.com/commentary/reuters-open-interest/bond-blowback-trumps-oil-grab-broadcom-blues-financial-week-five-charts-2026-09-04/
· Reuters, Global money funds draw biggest inflow in nearly a month as investors turn cautious, published 4 September 2026. https://www.reuters.com/world/china/global-markets-flows-graphic-2026-09-04/
· Reuters, ECB to raise rates a second time in September, but then done, say economists: Reuters poll, published 3 September 2026. https://www.reuters.com/world/ecb-raise-rates-second-time-september-then-done-say-economists-2026-09-03/
· Reuters, European shares log weekly losses on inflation worries; Volkswagen jumps, published 4 September 2026. https://www.reuters.com/business/autos-transportation/european-shares-edge-lower-ahead-of-us-jobs-data-volkswagen-jumps-2026-09-04/
· Reuters, China's August factory activity picks up as demand improves, PMI shows, published 1 September 2026. https://www.reuters.com/world/asia-pacific/chinas-august-factory-activity-picks-up-demand-improves-pmi-shows-2026-09-01/
· Associated Press, China's factory activity contracts in August despite an uptick in export demand, published 31 August 2026. https://apnews.com/article/6d33b11dfd3c1ee834b169274f58f825
· Reuters, Yen's changing fortunes might finally be spooking the bears, published 4 September 2026. https://www.reuters.com/world/asia-pacific/yens-changing-fortunes-might-finally-be-spooking-bears-2026-09-04/
· Reuters, Bank of England's Bailey sees long-term pressures driving up government debt, published 4 September 2026. https://www.reuters.com/world/uk/bank-englands-bailey-sees-long-term-pressures-driving-up-government-debt-2026-09-04/
· Reuters, Gold falls to two-week low as rising Treasury yields, dollar weigh, published 1 September 2026. https://www.reuters.com/world/india/gold-muted-traders-await-us-jobs-data-monitor-mideast-tensions-2026-09-01/
· Reuters, Gold slides after robust US payrolls boost rate hike bets, published 4 September 2026. https://www.reuters.com/world/india/gold-holds-ground-with-us-payrolls-data-radar-2026-09-04/

Comments